pygmt.Figure.basemap
- Figure.basemap(projection=None, region=None, verbose=False, panel=False, transparency=None, **kwargs)
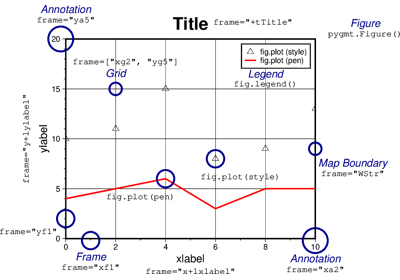
Plot base maps and frames.
Creates a basic or fancy basemap with axes, fill, and titles. Several map projections are available, and the user may specify separate tick-mark intervals for boundary annotation, ticking, and [optionally] gridlines. A simple map scale or directional rose may also be plotted.
At least one of the parameters
frame,map_scale,rose, orcompassmust be specified if not in subplot mode.Full GMT docs at https://docs.generic-mapping-tools.org/6.6/basemap.html.
Aliases:
B = frame
F = box
JZ = zsize
Jz = zscale
L = map_scale
Td = rose
Tm = compass
f = coltypes
p = perspective
J = projection
R = region
V = verbose
c = panel
t = transparency
- Parameters:
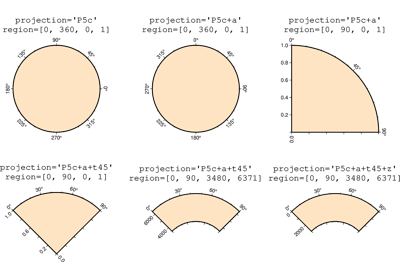
projection (
str|None, default:None) – projcode[projparams/]width|scale. Select map projection.zscale/zsize (float or str) – Set z-axis scaling or z-axis size.
region (str or list) – xmin/xmax/ymin/ymax[+r][+uunit]. Specify the region of interest. Required if this is the first plot command.
frame (bool, str, or list) – Set map boundary frame and axes attributes.
map_scale (str) – [g|j|J|n|x]refpoint+wlength. Draw a simple map scale centered on the reference point specified.
box (bool or str) – [+cclearances][+gfill][+i[[gap/]pen]][+p[pen]][+r[radius]][+s[[dx/dy/][shade]]]. If set to
True, draw a rectangular border around the map scale or rose. Alternatively, specify a different pen with +ppen. Add +gfill to fill the scale panel [Default is no fill]. Append +cclearance where clearance is either gap, xgap/ygap, or lgap/rgap/bgap/tgap where these items are uniform, separate x and y, or individual side spacings between scale and border. Append +i to draw a secondary, inner border as well. We use a uniform gap between borders of 2 points and the MAP_DEFAULTS_PEN unless other values are specified. Append +r to draw rounded rectangular borders instead, with a 6-points corner radius. You can override this radius by appending another value. Finally, append +s to draw an offset background shaded region. Here, dx/dy indicates the shift relative to the foreground frame [Default is"4p/-4p"] and shade sets the fill style to use for shading [Default is"gray50"].rose (str) – Draw a map directional rose on the map at the location defined by the reference and anchor points.
compass (str) – Draw a map magnetic rose on the map at the location defined by the reference and anchor points.
verbose (bool or str) – Select verbosity level [Full usage].
panel (
int|tuple[int,int] |bool, default:False) –Select a specific subplot panel. Only allowed when used in
Figure.subplotmode.Trueto advance to the next panel in the selected order.index to specify the index of the desired panel.
(row, col) to specify the row and column of the desired panel.
The panel order is determined by the
Figure.subplotmethod. row, col and index all start at 0.coltypes (str) – [i|o]colinfo. Specify data types of input and/or output columns (time or geographical data). Full documentation is at https://docs.generic-mapping-tools.org/6.6/gmt.html#f-full.
perspective (list or str) – [x|y|z]azim[/elev[/zlevel]][+wlon0/lat0[/z0]][+vx0/y0]. Select perspective view and set the azimuth and elevation angle of the viewpoint [Default is
[180, 90]]. Full documentation is at https://docs.generic-mapping-tools.org/6.6/gmt.html#perspective-full.transparency (float) – Set transparency level, in [0-100] percent range [Default is
0, i.e., opaque]. Only visible when PDF or raster format output is selected. Only the PNG format selection adds a transparency layer in the image (for further processing).