pygmt.grdhisteq.compute_bins
- static grdhisteq.compute_bins(grid, output_type='pandas', outfile=None, region=None, verbose=False, **kwargs)[source]
Perform histogram equalization for a grid.
Histogram equalization provides a way to highlight data that has most values clustered in a small portion of the dynamic range, such as a grid of flat topography with a mountain in the middle. Ordinary gray shading of this grid (using
pygmt.Figure.grdimageorpygmt.Figure.grdview) with a linear mapping from topography to graytone will result in most of the image being very dark gray, with the mountain being almost white.pygmt.grdhisteq.compute_binscan provide a list of data values that divide the data range into divisions which have an equal area in the image [Default is 16 ifdivisionsis not set]. Thepandas.DataFrameor ASCII file output can be used to make a colormap withpygmt.makecptand an image withpygmt.Figure.grdimagethat has all levels of gray occurring equally.Full GMT docs at https://docs.generic-mapping-tools.org/6.6/grdhisteq.html.
Aliases:
C = divisions
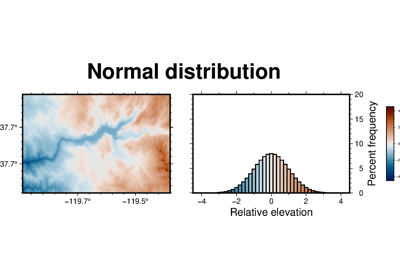
N = gaussian
Q = quadratic
h = header
R = region
V = verbose
- Parameters:
grid (
str|PathLike|DataArray) –Name of the input grid file or the grid loaded as a
xarray.DataArrayobject.For reading a specific grid file format or applying basic data operations, see https://docs.generic-mapping-tools.org/6.6/gmt.html#grd-inout-full for the available modifiers.
output_type (
Literal['pandas','numpy','file'], default:'pandas') –Desired output type of the result data.
pandaswill return apandas.DataFrameobject.numpywill return anumpy.ndarrayobject.filewill save the result to the file specified by theoutfileparameter.
outfile (
str|PathLike|None, default:None) – File name for saving the result data. Required ifoutput_type="file". If specified,output_typewill be forced to be"file".divisions (int) – Set the number of divisions of the data range.
quadratic (bool) – Perform quadratic equalization [Default is linear].
region (str or list) – xmin/xmax/ymin/ymax[+r][+uunit]. Specify the region of interest.
verbose (bool or str) – Select verbosity level [Full usage].
header (str) –
[i|o][n][+c][+d][+msegheader][+rremark][+ttitle]. Specify that input and/or output file(s) have n header records [Default is 0]. Prepend i if only the primary input should have header records. Prepend o to control the writing of header records, with the following modifiers supported:
+d to remove existing header records.
+c to add a header comment with column names to the output [Default is no column names].
+m to add a segment header segheader to the output after the header block [Default is no segment header].
+r to add a remark comment to the output [Default is no comment]. The remark string may contain \n to indicate line-breaks.
+t to add a title comment to the output [Default is no title]. The title string may contain \n to indicate line-breaks.
Blank lines and lines starting with # are always skipped.
- Return type:
- Returns:
ret – Return type depends on
outfileandoutput_type:Noneifoutfileis set (output will be stored in file set byoutfile)pandas.DataFrameornumpy.ndarrayifoutfileis not set (depends onoutput_type)
Example
>>> import pygmt
>>> # Load a grid of @earth_relief_30m data, with a longitude range of
>>> # 10° E to 30° E, and a latitude range of 15° N to 25° N
>>> grid = pygmt.datasets.load_earth_relief(
...     resolution="30m", region=[10, 30, 15, 25]
... )
>>> # Find elevation intervals that split the data range into 5
>>> # divisions, each of which have an equal area in the original grid.
>>> bins = pygmt.grdhisteq.compute_bins(grid=grid, divisions=5)
>>> print(bins)
        start    stop
bin_id
0       183.5   395.0
1       395.0   472.0
2       472.0   575.0
3       575.0   709.5
4       709.5  1807.0
See also
Note
This method does a weighted histogram equalization for geographic grids to account for node area varying with latitude.