pygmt.Figure.wiggle
- Figure.wiggle(data=None, x=None, y=None, z=None, fillpositive=None, fillnegative=None, projection=None, region=None, verbose=False, panel=False, transparency=None, **kwargs)
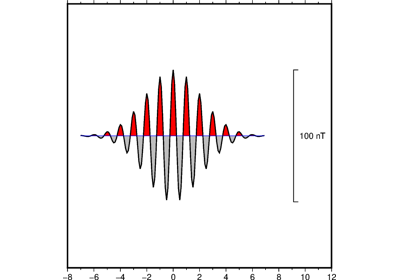
Plot z=f(x,y) anomalies along tracks.
Takes a matrix, (x, y, z) triplets, or a file name as input and plots z as a function of distance along track.
Must provide either
dataorx,y, andz.Full GMT docs at https://docs.generic-mapping-tools.org/6.6/wiggle.html.
Aliases:
B = frame
D = position
T = track
W = pen
Z = scale
b = binary
d = nodata
e = find
f = coltypes
g = gap
h = header
i = incols
p = perspective
w = wrap
G = +p: fillpositive, +n: fillnegative
J = projection
R = region
V = verbose
c = panel
t = transparency
- Parameters:
x/y/z (1-D arrays) – The arrays of x and y coordinates and z data points.
data (
str|PathLike|dict|ndarray|DataFrame|Dataset|GeoDataFrame|None, default:None) – Pass in either a file name to an ASCII data table, a 2-Dnumpy.ndarray, apandas.DataFrame, anxarray.Datasetmade up of 1-Dxarray.DataArraydata variables, or ageopandas.GeoDataFramecontaining the tabular data. Use parameterincolsto choose which columns are x, y, z, respectively.projection (
str|None, default:None) – projcode[projparams/]width|scale. Select map projection.region (str or list) – xmin/xmax/ymin/ymax[+r][+uunit]. Specify the region of interest.
scale (str or float) – Give anomaly scale in data-units/distance-unit. Append c, i, or p to indicate the distance unit (centimeters, inches, or points); if no unit is given we use the default unit that is controlled by PROJ_LENGTH_UNIT.
frame (bool, str, or list) – Set map boundary frame and axes attributes.
position (str) – [g|j|J|n|x]refpoint+wlength[+jjustify][+al|r][+odx[/dy]][+l[label]]. Define the reference point on the map for the vertical scale bar.
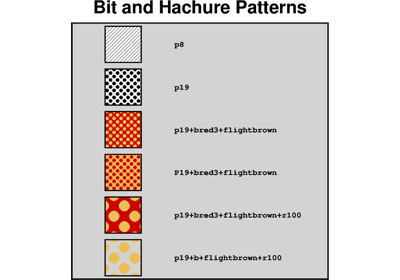
fillpositive (str) – Set color or pattern for filling positive wiggles [Default is no fill].
fillnegative (str) – Set color or pattern for filling negative wiggles [Default is no fill].
track (str) – Draw track [Default is no track]. Append pen attributes to use [Default is
"0.25p,black,solid"].verbose (bool or str) – Select verbosity level [Full usage].
pen (str) – Specify outline pen attributes [Default is no outline].
i|o[ncols][type][w][+l|b]. Select native binary input (using
binary="i") or output (usingbinary="o"), where ncols is the number of data columns of type, which must be one of:c: int8_t (1-byte signed char)
u: uint8_t (1-byte unsigned char)
h: int16_t (2-byte signed int)
H: uint16_t (2-byte unsigned int)
i: int32_t (4-byte signed int)
I: uint32_t (4-byte unsigned int)
l: int64_t (8-byte signed int)
L: uint64_t (8-byte unsigned int)
f: 4-byte single-precision float
d: 8-byte double-precision float
x: use to skip ncols anywhere in the record
For records with mixed types, append additional comma-separated combinations of ncols type (no space). The following modifiers are supported:
w after any item to force byte-swapping.
+l|b to indicate that the entire data file should be read as little- or big-endian, respectively.
Full documentation is at https://docs.generic-mapping-tools.org/6.6/gmt.html#bi-full.
panel (
int|tuple[int,int] |bool, default:False) –Select a specific subplot panel. Only allowed when used in
Figure.subplotmode.Trueto advance to the next panel in the selected order.index to specify the index of the desired panel.
(row, col) to specify the row and column of the desired panel.
The panel order is determined by the
Figure.subplotmethod. row, col and index all start at 0.nodata (str) – i|onodata. Substitute specific values with NaN (for tabular data). For example,
nodata="-9999"will replace all values equal to -9999 with NaN during input and all NaN values with -9999 during output. Prepend i to the nodata value for input columns only. Prepend o to the nodata value for output columns only.find (str) – [~]“pattern” | [~]/regexp/[i]. Only pass records that match the given pattern or regular expressions [Default processes all records]. Prepend ~ to the pattern or regexp to instead only pass data expressions that do not match the pattern. Append i for case insensitive matching. This does not apply to headers or segment headers.
coltypes (str) – [i|o]colinfo. Specify data types of input and/or output columns (time or geographical data). Full documentation is at https://docs.generic-mapping-tools.org/6.6/gmt.html#f-full.
x|y|z|d|X|Y|Dgap[u][+a][+ccol][+n|p]. Examine the spacing between consecutive data points in order to impose breaks in the line. To specify multiple criteria, provide a list with each item containing a string describing one set of criteria.
x|X: define a gap when there is a large enough change in the x coordinates (uppercase to use projected coordinates).
y|Y: define a gap when there is a large enough change in the y coordinates (uppercase to use projected coordinates).
d|D: define a gap when there is a large enough distance between coordinates (uppercase to use projected coordinates).
z: define a gap when there is a large enough change in the z data. Use +ccol to change the z data column [Default col is 2 (i.e., 3rd column)].
A unit u may be appended to the specified gap:
For geographic data (x|y|d), the unit may be arc- d(egrees), m(inutes), and s(econds), or (m)e(ters), f(eet), k(ilometers), M(iles), or n(autical miles) [Default is (m)e(ters)].
For projected data (X|Y|D), the unit may be i(nches), c(entimeters), or p(oints).
Append modifier +a to specify that all the criteria must be met [default imposes breaks if any one criterion is met].
One of the following modifiers can be appended:
+n: specify that the previous value minus the current column value must exceed gap for a break to be imposed.
+p: specify that the current value minus the previous value must exceed gap for a break to be imposed.
header (str) –
[i|o][n][+c][+d][+msegheader][+rremark][+ttitle]. Specify that input and/or output file(s) have n header records [Default is 0]. Prepend i if only the primary input should have header records. Prepend o to control the writing of header records, with the following modifiers supported:
+d to remove existing header records.
+c to add a header comment with column names to the output [Default is no column names].
+m to add a segment header segheader to the output after the header block [Default is no segment header].
+r to add a remark comment to the output [Default is no comment]. The remark string may contain \n to indicate line-breaks.
+t to add a title comment to the output [Default is no title]. The title string may contain \n to indicate line-breaks.
Blank lines and lines starting with # are always skipped.
incols (str or 1-D array) –
Specify data columns for primary input in arbitrary order. Columns can be repeated and columns not listed will be skipped [Default reads all columns in order, starting with the first (i.e., column 0)].
For 1-D array: specify individual columns in input order (e.g.,
incols=[1,0]for the 2nd column followed by the 1st column).For
str: specify individual columns or column ranges in the format start[:inc]:stop, where inc defaults to 1 if not specified, with columns and/or column ranges separated by commas (e.g.,incols="0:2,4+l"to input the first three columns followed by the log-transformed 5th column). To read from a given column until the end of the record, leave off stop when specifying the column range. To read trailing text, add the column t. Append the word number to t to ingest only a single word from the trailing text. Instead of specifying columns, useincols="n"to simply read numerical input and skip trailing text. Optionally, append one of the following modifiers to any column or column range to transform the input columns:+l to take the log10 of the input values.
+d to divide the input values by the factor divisor [Default is 1].
+s to multiple the input values by the factor scale [Default is 1].
+o to add the given offset to the input values [Default is 0].
perspective (list or str) – [x|y|z]azim[/elev[/zlevel]][+wlon0/lat0[/z0]][+vx0/y0]. Select perspective view and set the azimuth and elevation angle of the viewpoint [Default is
[180, 90]]. Full documentation is at https://docs.generic-mapping-tools.org/6.6/gmt.html#perspective-full.transparency (float) – Set transparency level, in [0-100] percent range [Default is
0, i.e., opaque]. Only visible when PDF or raster format output is selected. Only the PNG format selection adds a transparency layer in the image (for further processing).wrap (str) –
y|a|w|d|h|m|s|cperiod[/phase][+ccol]. Convert the input x-coordinate to a cyclical coordinate, or a different column if selected via +ccol. The following cyclical coordinate transformations are supported:
y: yearly cycle (normalized)
a: annual cycle (monthly)
w: weekly cycle (day)
d: daily cycle (hour)
h: hourly cycle (minute)
m: minute cycle (second)
s: second cycle (second)
c: custom cycle (normalized)
Full documentation is at https://docs.generic-mapping-tools.org/6.6/gmt.html#w-full.